

Wafer Cleaning System Supplier Evaluation Guide for Semiconductor Manufacturing
2026-10-19
Every angstrom matters in wafer cleaning, yet many fabs still treat supplier selection as a checkbox exercise. A single overlooked contaminant or a marginally underperforming tool can cascade into yield loss that no process tweak can recover. This guide unpacks the evaluation criteria that separate dependable wafer cleaning partners from risky ones—and why advanced acoustic and megasonic solutions from Siansonic are increasingly appearing on serious shortlists.
Beyond the Spec Sheet: What Actually Ends Up on the Wafer
规格表描绘了理想化的器件参数,但晶圆上的实际分布很少完全一致。例如,阈值电压在晶圆中心与边缘可能相差数十毫伏,而互连线的临界尺寸则受到光刻胶厚度和显影时间的细微影响。
制造过程中的随机缺陷和系统误差共同塑造了最终成品。一颗尘埃粒子落在关键区域,就能让整片die失效;而机台校准的微小漂移,则会在整片晶圆上留下可重复的图案。这些都不是规格表能提前预见的。
真正有经验的工程师知道,良率提升的秘密藏在晶圆图里——那些分布图、热图和失效bin的统计,比任何数据手册都更接近物理现实。规格表是起点,但实际落在晶圆上的,是工艺、设备和材料之间无数次交互的结果。
Particle Counts, Defect Maps, and the Numbers That Matter
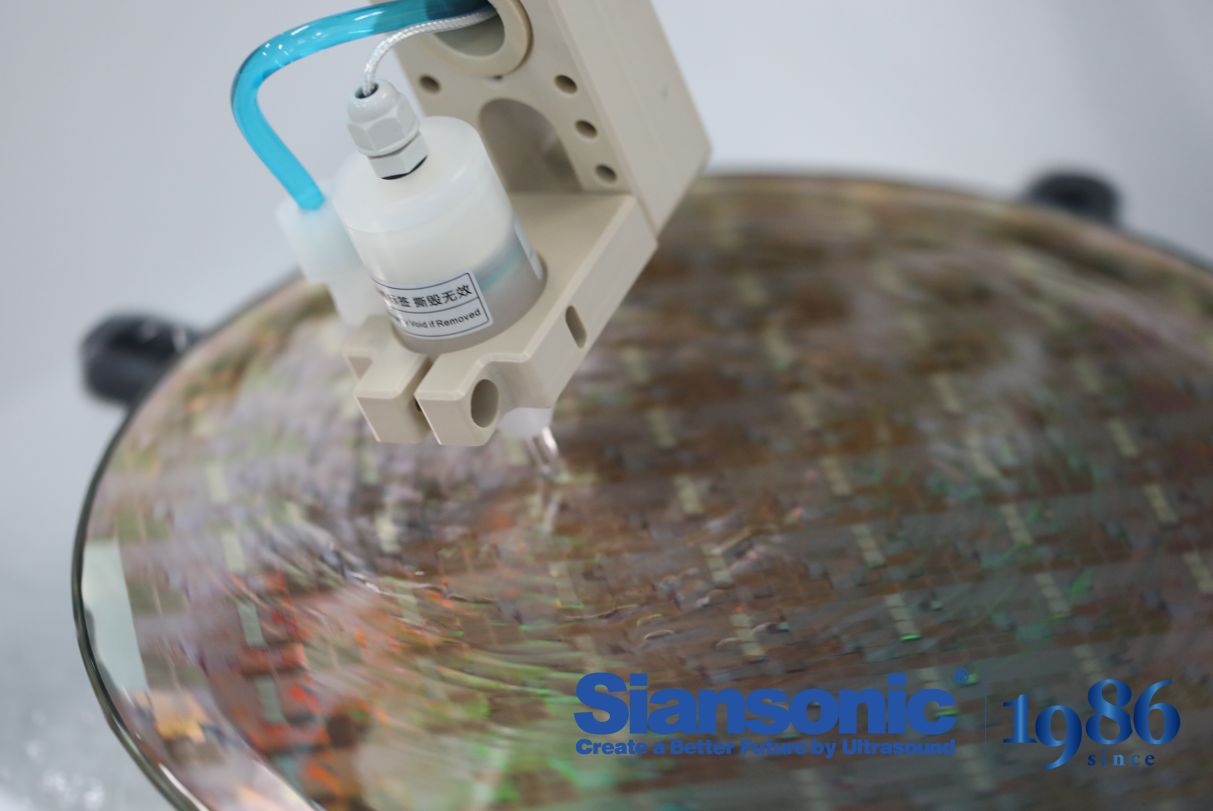
Particle counts on a wafer often get treated as a single headline number, but that number hides more than it reveals. A count of forty-seven particles means one thing if they are scattered randomly and something entirely different if thirty of them cluster near the edge of the exposure field.
Defect maps turn those raw counts into a spatial story. Overlaying particle locations with reticle patterns, wafer topography, or process chamber flow paths makes it possible to see whether contamination is coming from a specific tool, a chemical bath, or a handling step. Without the map, you are hunting blind.
The numbers that actually matter are not the total particle count. Defect density per square centimeter, killer defect rate, and yield impact per defect class give a much sharper picture of whether a process is drifting out of control. A jump from three to five particles might be noise; a shift from random to clustered defects at the same total count can be an early warning of a failing filter or a cracked edge ring.
Tying Cleaning Performance to Your Fab's Yield Ceiling
Every defect that survives a wet clean step quietly narrows the process window for the next layer. When particle removal efficiency and metal contamination levels drift, yields rarely collapse all at once. Instead, the fab's ceiling drops: the same toolset, recipes, and metrology that once delivered 92% now produce 88% and nobody can point to a single catastrophic event.
The connection becomes clearer when you treat cleaning not as a standalone module but as a gatekeeper for pattern fidelity. Residues measured in atoms per square centimeter can shift line edge roughness enough to kill advanced nodes. A marginal clean leaves behind a thin organic veil that changes adhesion, etch bias, or contact resistance. Those small losses compound across hundreds of steps, so a 0.1% defect uptick per clean can erode the yield ceiling by several points before excursion alarms trigger.
Fabs that sustain high yields usually monitor cleaning performance against the same statistical baselines used for lithography or deposition. They track daily defect density after each clean, link lot-level particle counts to final sort maps, and adjust chemical baths before residue signatures become visible on wafers. In that sense, the cleaning bench is not just a cost center; it is the lever that determines whether your yield ceiling stays fixed or quietly drops.
The Maintenance Trap: Why Uptime Claims Need a Second Look
Uptime numbers look reassuring on a status page, but they rarely tell the whole story. A provider can hit 99.9% availability while still subjecting users to slow response times, partial outages, or maintenance windows that happen to fall during your peak hours. The metric is often calculated over a convenient period, and it quietly excludes the moments when the service was technically "up" but effectively unusable.
The real trap is that maintenance itself gets folded into those figures in ways that favor the vendor. Some providers schedule upgrades during low-traffic hours and call it proactive care, yet those windows can still disrupt automated jobs, time-sensitive processes, or teams in other time zones. Others apply patches without full failover testing, so the system stays online but loses data or consistency for a few minutes—an incident that never shows up as downtime.
Before trusting an uptime claim, ask what it actually measures. Look for definitions of "available," how maintenance is classified, and whether degraded performance counts. A better question is not just "was it up?" but "was it working well when I needed it?" That second look often reveals a gap between the marketing number and the lived experience of the people depending on the service.
Chemical and Water Consumption That Shows Up in Operating Costs
Chemical expenses rarely show up as a single line item on a monthly utility bill, but they are buried in nearly every water-using process. Cooling towers, boilers, and closed-loop systems all demand scale inhibitors, corrosion inhibitors, biocides, and pH adjusters to keep equipment from fouling or failing. As makeup water quality fluctuates, so does the required dosage, and each blowdown cycle flushes a portion of those chemicals straight to drain. Operators who track only water volume often miss the parallel cost: every gallon of water sent to sewer carries treatment chemicals with it, turning what looks like a modest water bill into a much larger combined operating expense.
Rising water and sewer rates have changed the math on how much chemical feed is actually economical. Where decades ago an operator might simply increase blowdown to avoid scaling, today that practice multiplies both water intake and chemical replacement costs. Many facilities now run at higher cycles of concentration, which cuts total makeup water demand but demands more precise scale and corrosion control. The trade-off is not always obvious from vendor data sheets, because the cheapest chemical per drum can require higher dosages or more frequent blowdown. A full cost-per-1,000-gallons analysis—factoring in water purchase, sewer discharge fees, and chemical consumption—often shows that a slightly more expensive inhibitor reduces overall operating cost.
Practical reductions come from tightening the link between water quality monitoring and chemical dosing. Installing flow-paced feed systems or conductivity-based blowdown controls prevents overfeeding during low-load periods and avoids the waste that happens when operators manually adjust pumps based on occasional grab samples. Some plants also substitute non-potable or reclaimed water for specific rinse or cooling tasks, but this only pays off if the change does not force a large increase in biocide or anti-scalant usage. The goal is not simply to use less water or less chemical in isolation, but to lower the combined cost per unit of production—and that combined metric is what finally shows up in operating cost reviews.
From R&D to High-Volume: Will This Cleaner Scale?
Moving a bench-scale formula to full production isn't just about multiplying ingredient amounts. Mixing speeds change, heat transfer behaves differently in a 5,000-gallon vessel, and a surfactant that dissolves fine in a beaker can turn cloudy or separate after sitting in a holding tank for a weekend. The first production trial often exposes things the lab never sees: pump shear degrading a polymer, foam building up in the transfer line, or a preservative that works at pH 6.2 but not at the 6.0 batch-to-batch drift.
Then comes the pace. A pilot run might fill fifty bottles per minute without issue, but at two hundred per minute, fill-head drips become spills, capping torque drifts, and label alignment shifts. Packaging suppliers may be fine for samples; for container loads, lead times stretch. The cleaning agent itself has to stay homogeneous across a 24-hour continuous blending run, because settling in a rail car or tote can mean the first drum off the line isn't the same as the last.
Cost and QC are the quieter gatekeepers. Lab-grade raw materials often get replaced by technical-grade alternatives to meet margin targets, and those can bring trace impurities that affect color or odor months later. A robust scale-up plan usually includes not one but three or more pilot batches, accelerated stability on production-filled samples, and line trials with actual filling equipment—not benchtop simulators. If those aren't on the calendar early, the cleaner may work beautifully in the R&D lab and still fail at 10,000 gallons.
FAQ
Start with the cleaning performance on your most sensitive layer stack, not the quoted throughput. Ask for particle removal efficiency data on blanket wafers with the same film types you run, then ask for patterned wafer defect maps. Check if the supplier can demonstrate single-wafer and batch options that match your queue-time constraints. Also weigh their chemical delivery precision and reclaim capability, because consumable cost often overtakes the initial tool price within two years. A shortlist that ignores local service response time or parts depots will create trouble later.
Request a joint demo using your own monitor wafers, not polished vendor samples. Look at particle counts by size bin, especially below 40 nm, before and after multiple passes. Ask for data on drying-related adders and bevel cleanliness. Have your defect inspection team review the raw maps instead of summary bar charts. A credible supplier will also share repeatability runs across different chambers, not just one golden tool. If they hesitate to run your wafers or sign a performance specification with liquidated damages for particle excursions, that is a red flag.
Look at how they handle process change requests. A strong supplier has a local process engineering team that can tune recipes for new materials without waiting for headquarters approval. Check their installed base in fabs running similar device architectures, and ask for the names of engineers you can call, not sales contacts. Also examine their software roadmap: can they add new sensors, traceability logs, and data export without a custom integration fee each time? The best suppliers treat cleaning as a process partnership, not a tool sale.
Vendor recommendations often assume a narrow range of film stacks and may miss interactions with new low-k dielectrics, metal hardmasks, or photoresist residues unique to your flow. You should run split-lot tests that expose short-loop wafers to the full cleaning sequence, then measure sheet resistance shift, surface roughness, and material loss. For galvanic corrosion risk, test structures with exposed copper and barrier metals. Ask for material safety and waste treatment reports for any proprietary chemistries. A supplier that insists on only their own chemistry without explaining the reaction pathways should face extra scrutiny.
A cleaning system without built-in particle monitor data logging adds hidden labor. The tool should export post-clean defect counts, chamber conditions, and chemical usage in a format your yield management system can ingest directly. Ask for evidence of automated SPC alerts tied to specific chambers, not just tool-level averages. In advanced fabs, the ability to correlate a particle excursion with a maintenance event or a chemical batch change can save weeks of root-cause analysis. If the supplier cannot demonstrate this integration, factor in the cost of manual data pulls and potential misprocessing.
Use a dedicated short-loop test vehicle that runs during scheduled tool abatement or pilot line windows. Carry monitor wafers through the cleaning system and compare them against a reference tool using the same lot splits. Focus on defect adders, metal contamination via VPD-ICP-MS on a few samples, and electrical test shifts on simple capacitor or via chain structures. Keep the test protocol short enough to repeat weekly, so you can detect drift. Avoid accepting a one-time marathon demo that hides instability under ideal conditions.
Pay attention to process qualification criteria and the definition of acceptance. Many contracts state acceptance after a single particle run on vendor-selected wafers, which leaves you empty-handed when your product wafers fail later. Negotiate for a warranty period tied to your specific film stacks and particle budgets, with clear remedy steps. Also lock in pricing for spare parts, chemical consumption, and software upgrades for at least three years. Check the escalation path for unresolved tool issues, including access to factory engineering. Finally, include an exit clause if the supplier discontinues support for your tool model.
Conclusion
A cleaner's data sheet rarely tells you what ends up on the wafer after the final rinse. The real evaluation starts with residue films, trace metals, and organic monolayers that survive otherwise impressive particle removal specs. Ask suppliers to run defect maps on your actual device wafers, not just monitor silicon, and compare post-clean adders at the same sensitivity your inspection tools will use in production. That shift from generic particle counts to defectivity on product-like structures is what separates a cleaning step that looks good in a demo from one that protects your yield ceiling.
Beyond baseline performance, dig into maintenance intervals, actual uptime under your chemical mix, and consumables consumption per wafer pass. Many vendors quote best-case uptime that crumbles once you factor in preventive maintenance, brush or nozzle changes, and bath lifetime. Tie those numbers to operating cost—chemical and water usage often dwarf the capital expense over five years. Finally, pressure the supplier for high-volume data: can the chamber-to-chamber uniformity and defect performance hold at 10,000 wafers per month, or does the process drift as consumables age? If the answers stay vague or reference only R&D lots, you are not buying a manufacturing tool; you are inheriting someone else's scale-up problem.
Contact Us
Contact Person: Ivy Zhang
Email: [email protected]
Tel/WhatsApp: +86 1081502288
Website: https://www.siansonic.com/