

Digital Vacuum Gauge Company Expertise for Reliable Vacuum Measurement
2026-11-16
Precision vacuum readings rarely fail loudly. More often, they drift just enough to compromise a process without anyone noticing until something goes wrong. That silent risk is why expertise in digital vacuum gauge technology matters as much as the sensor itself. HONGSEN brings practical, field-tested vacuum measurement knowledge to every gauge we build, helping you maintain stable, repeatable vacuum levels instead of chasing false readings. Here’s what to look for when reliability cannot be left to chance.
How Digital Vacuum Gauges Eliminate Guesswork in the Field
Analog vacuum gauges have long been a source of frustration for technicians. The needle hovers between markings, the lighting is rarely ideal, and two people can read the same pressure completely differently. One technician might see 500 microns, another swears it's closer to 800. That uncertainty can lead to premature pump shutoff or unnecessary callbacks. Digital vacuum gauges put an end to that by displaying the exact pressure on a clear screen. No interpolation, no squinting, no second-guessing. You read the number, and that's the pressure.
Beyond just giving a precise reading, many digital gauges also log data over time. This means you can watch the vacuum level drop and confirm it's holding steady before you move on. In the field, that translates to faster diagnostics. Instead of waiting and wondering if the system is actually tight, you can see a flat line on the gauge's display or scroll through a history of readings. The guesswork disappears because you're working with recorded facts, not fleeting needle positions.
Another overlooked advantage is that digital gauges often compensate for temperature and sensor drift automatically. With analog units, you had to mentally factor in those variables or trust that the gauge was still calibrated. Digital models do that heavy lifting internally, so the number you see is already corrected. That removes another layer of uncertainty. You spend less time questioning your tools and more time completing the job right the first time.
Sensor Types That Match Different Vacuum Levels
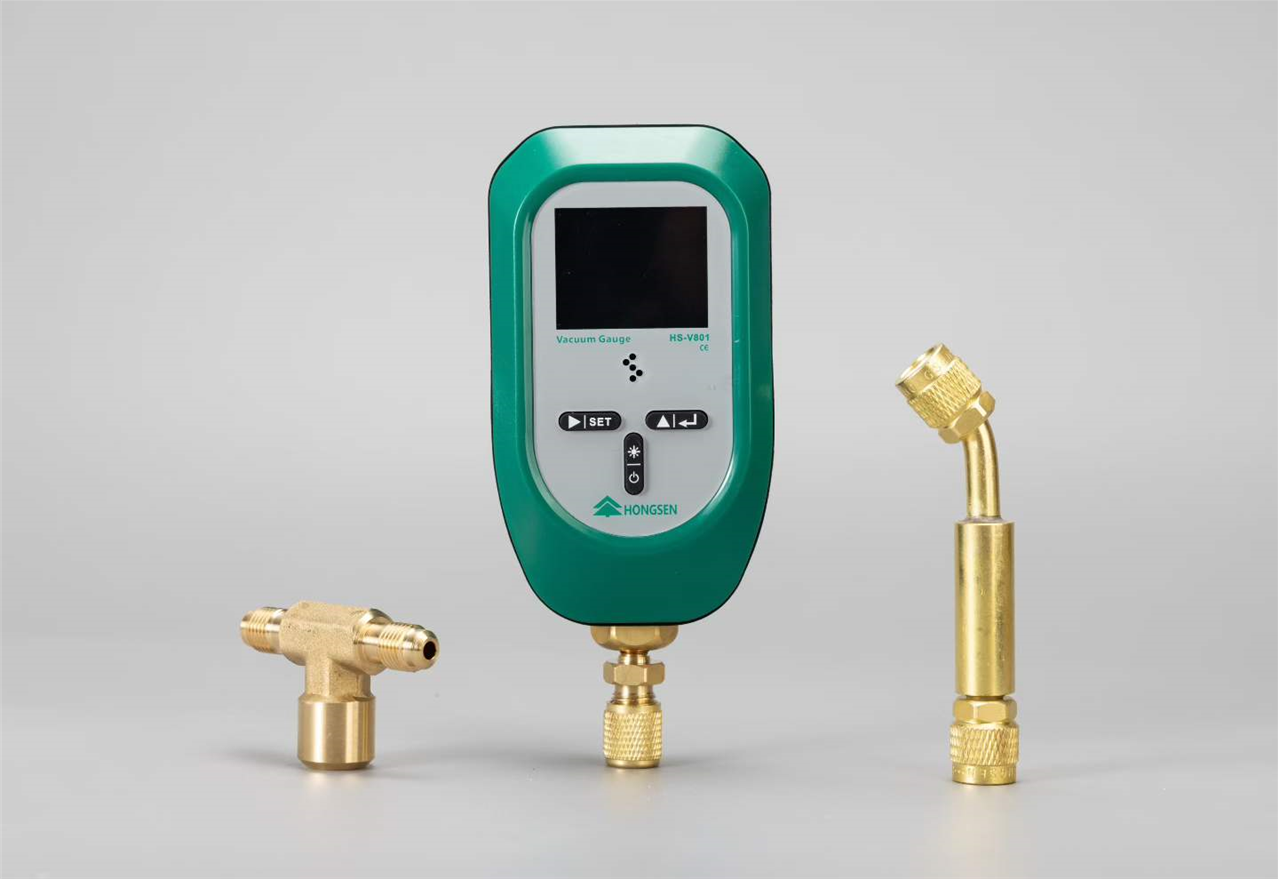
Choosing the right vacuum sensor isn't just about picking the most precise one on the shelf—it hinges on the pressure range you actually work in. Pirani and thermocouple gauges handle rough vacuum well, from atmosphere down to about 10⁻³ mbar, because they rely on thermal conductivity of the remaining gas, which fades out at lower pressures. For medium to high vacuum, cold cathode and hot cathode ionization gauges step in, covering roughly 10⁻³ to 10⁻¹¹ mbar, though they differ in cleanliness and sensitivity to contamination. Capacitance manometers, by contrast, deliver gas-independent absolute readings from atmosphere down to 10⁻⁵ mbar, making them ideal when you need to measure true pressure regardless of gas composition.
The practical distinction often comes down to what you can tolerate in terms of maintenance and exposure. Thermal conductivity gauges are cheap and robust but drift with gas type and filament aging, so they suit roughing lines and foreline monitoring. Ionization gauges are delicate and can pump or crack residual gases, yet they remain the go-to for high-vacuum chambers where every decade of pressure matters. Meanwhile, capacitance manometers bring long-term stability and zero gas dependence at a higher price and bulk, which explains why they appear in semiconductor processes and calibration labs rather than on every rough pump skid.
Matching the sensor to the vacuum level also means thinking about what happens at transition points. A system that cycles from atmosphere to 10⁻⁶ mbar often pairs a Pirani gauge for startup and venting with a cold cathode for deep vacuum, switched by a controller that knows each sensor's reliable range. Relying on a single gauge across the full span invites either burnout at high pressure or lost resolution at low pressure. So the real skill isn't finding one perfect sensor—it's building a small fleet that hands off cleanly, keeping your readings trustworthy across the whole journey.
Why Calibration Schedules Matter More Than Most Teams Assume
Most teams treat calibration as a maintenance checkbox—something to schedule when a sensor starts acting up or when an audit is on the horizon. The reality is quieter and more expensive. Small drifts in measurement accuracy rarely announce themselves; they accumulate inside daily outputs until decisions made on that data start leaning the wrong way. By the time someone notices the pattern, the cost has already spread across shipments, reports, or product batches.
A fixed schedule flips that dynamic. Instead of reacting to visible failures, teams catch drift before it becomes a decision. That shift matters because calibration isn't just about hardware—it's about confidence in the numbers people argue over in meetings. When the schedule is treated as a first-class commitment rather than an afterthought, the entire feedback loop tightens. Rework drops, sign-offs happen faster, and fewer late-night "is this even right?" conversations occur.
There's also a hidden organizational cost to irregular calibration: it erodes trust in the data itself. Once a team has been burned by an out-of-spec reading that nobody caught, every future measurement gets second-guessed. That hesitation slows down work far more than the calibration downtime ever did. A predictable schedule, even a slightly conservative one, buys back speed because people stop debating whether the instrument can be believed.
Common Installation Errors That Distort Pressure Readings
Most distorted pressure readings trace back to how the sensing line is routed. A classic mistake is leaving a horizontal run or a sag that traps liquid in a gas service or air in a liquid service. Even a small pocket can act like a spring, delaying the signal and shaving off peaks. Another frequent problem is mounting the transmitter below the tap without a condensate pot in steam service, which lets hot vapor hit the diaphragm directly and throws off calibration.
Tap placement matters just as much as the instrument itself. Putting the pressure tap in a high-velocity zone or too close to a bend, valve, or pump discharge picks up dynamic pressure noise rather than true static pressure. Long, unsupported impulse lines vibrate and can develop fatigue cracks, while undersized tubing slows response and increases the chance of plugging. In cold climates, missing heat tracing or insulation on wet legs allows freezing or density shifts that quietly corrupt the reading long before anyone notices a fault.
Reading Stability in Harsh Process Environments
In many industrial settings, process instruments are expected to deliver reliable readings even when temperatures swing wildly, pressure surges occur without warning, or corrosive vapors drift through the air. The measuring cell, often the most sensitive part of a transmitter, can drift or degrade if not protected from these stresses. One practical approach is to isolate the sensor from direct contact with the process fluid using chemically resistant diaphragms and fill fluids that remain stable across a wide temperature band. Without this kind of design, even a well-calibrated device can produce readings that slowly wander away from the true value, leading operators to make adjustments based on faulty data.
Another factor that affects reading stability is the buildup of coatings or deposits on the sensing surface. In applications involving viscous polymers, slurries, or fluids with suspended solids, a thin layer can form over time and act as an insulating barrier, delaying the sensor's response or causing it to read a lower value than actual. Some transmitters counter this with a flush-mounted sensor and a self-cleaning mechanism, or by using a larger diaphragm that is less prone to fouling. In addition, advanced digital filtering can help distinguish between genuine process fluctuations and the slow drift caused by deposit formation, but this only works if the underlying measurement remains fundamentally stable.
Electrical and mechanical protection also plays a central role in keeping readings steady. Vibration from nearby pumps or compressors can loosen internal connections or induce microphonic noise in the sensor signal. Sealed enclosures with proper ingress protection, along with vibration damping mounts, prevent these external disturbances from reaching the measurement element. Field experience shows that instruments that combine robust physical isolation, careful material selection, and signal conditioning tend to hold their calibration far longer in harsh environments, reducing the need for frequent maintenance and giving operators confidence that the numbers they see are not drifting with every change in ambient conditions.
What a Supplier's Repair History Tells You About Reliability
A supplier's repair log is more than a stack of service tickets—it's a live record of how their equipment holds up under real operating conditions. A pattern of frequent, recurring fixes for the same component often points to a design flaw or substandard materials that won't magically disappear with a new purchase order. On the flip side, a sparse repair history with clear root-cause notes suggests that the supplier sweats the small stuff before it becomes a field failure.
Look closely at what gets repaired and why. Scheduled maintenance like filter swaps or belt tensioning tells you the supplier understands preventive care and isn't waiting for breakdowns. Unscheduled repairs, especially on critical subsystems, reveal weak points in quality control or engineering. Suppliers who document each fix with photos, failure analysis, and corrective actions are giving you a honest map of their product's true lifespan.
Transparency in repair history also predicts how the supplier will treat you after the sale. If they hide service bulletins or downplay repeat issues, expect the same evasiveness when your line goes down. A supplier that openly shares repair data—even the ugly parts—is building a track record you can actually trust. Reliability isn't about zero repairs; it's about a supplier who learns from every wrench turn and keeps improving the machine you're betting your output on.
FAQ
We use temperature-compensated Pirani and cold cathode sensors paired with adaptive filtering. Each unit is individually characterized across its full range, and the firmware corrects for ambient drift every few seconds. That way the reading you see reflects what's actually inside the chamber, not just a factory curve.
The main difference is how we map each sensor's behavior before it ships. We collect over 200 calibration points per transducer and store that map on the gauge itself. Then the internal electronics interpolate in real time, so a mid-range reading near 50 mTorr is as dependable as one at high vacuum.
Yes, the sensor bridge is built with low thermal mass and active overpressure protection. We've tested units through 10,000 cycles from atmosphere to 1e-6 Torr with less than 2% drift. That's a real-world spec, not just a datasheet number.
We provide pin-compatible analog outputs, RS-485, and Ethernet/IP variants. Our engineers routinely help labs map legacy controller pinouts to our gauges, and we keep the command set open so you aren't locked into a single software platform.
We recommend annual recharacterization, but the gauge itself stores a drift history. When you send it back, we compare its current output against the original map and tell you exactly what shifted and by how much. That kind of transparency keeps unexpected downtime off the table.
For those environments we offer nickel-coated and ceramic-sealed sensor heads. The electronics are isolated from the gas path, and the firmware includes a contamination baseline check. So even if a process leaves residue, you get a warning before the reading becomes unreliable.
Standard configurations usually ship within five business days. Custom flanges, longer cables, or special signal outputs typically add two weeks. We don't treat custom requests as an upsell; it's just another build ticket with a clearly defined test protocol.
Because we treat vacuum measurement as a calibration problem first, not a sensor assembly problem. Every gauge leaves with an individual response map, a written test report, and the engineer's contact info. That personal accountability is rare, and it changes how people trust their readings.
Conclusion
Field technicians once relied on mechanical gauges and gut instinct, but digital vacuum gauges replace that guesswork with direct, repeatable readings—especially when paired with the right sensor for the job. A thermocouple or Pirani sensor handles rough vacuum down to a few millitorr, while cold cathode and capacitance manometers step in for high and ultra-high vacuum ranges; choosing the wrong type is exactly how teams end up chasing phantom leaks or misreading process pressure. Calibration schedules, too, are often pushed aside until a reading drifts far enough to cause a scrap batch or a failed leak test, yet regular checks against a reference standard catch drift long before it becomes a production problem.
Installation mistakes make an even bigger dent in accuracy. Mounting a gauge too close to a pump inlet, using undersized tubing, or letting condensable vapors pool in the line can skew readings by an order of magnitude, and in harsh environments—think chemical vapor, particulate, or rapid temperature swings—stable signal processing and heated sensor options keep the measurement from bouncing around. Finally, a supplier's repair history tells you what the datasheet won't: if the same model comes back for filament replacements or electronics failures every few months, that pattern matters more than any accuracy spec. A company that tracks field returns, shares failure data, and designs for serviceability offers more than hardware; it provides the expertise to keep vacuum measurement dependable across real operating conditions.
Contact Us
Contact Person: KOPASS HO
Email: [email protected]
Tel/WhatsApp: 8613606566112
Website: https://www.hongsenref.com/